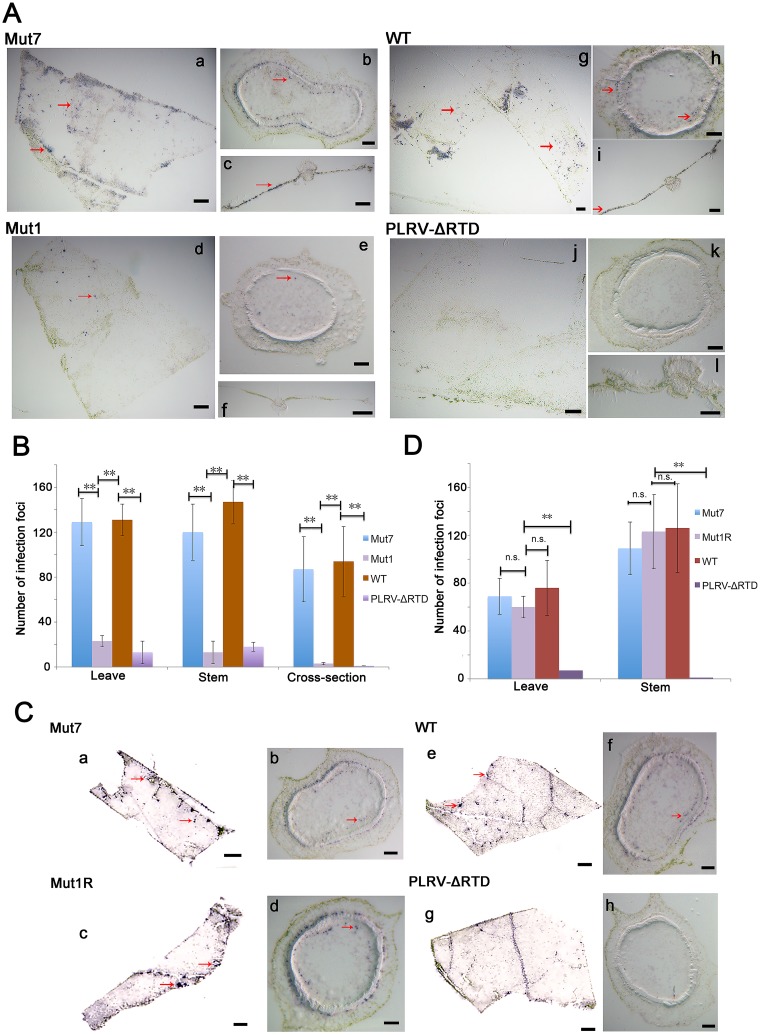
FIG 8.
(A and C) Tissue prints showing PLRV infection foci in HNS stem and leaf tissues systemically infected with Mut1, PLRV-ΔRTD (which does not translate RTP), and Mut7 (which translates RTP at near-wild-type levels). Tissue was collected at 3 wpi (A) and 9 wpi (C). By 9 wpi Mut1 has accumulated compensatory mutations that restored RTP translation. (B and D) Actual counts of infection foci. Tissue prints were developed with antibodies to PLRV, and virus was visualized as blue-stained foci of indoxyl precipitate. The prints were photographed under a microscope at a magnification of ×10 to ×35. Graphs show the average of 15 infection foci and represent the number of virus infection foci in the immunoprint cross sections photographed under a microscope. **, significant differences in the number of stained foci (P < 0.01 by one-way analysis of variance [ANOVA]); n.s., no significant difference. (A) Bars in panels a, c, d, f, g, i, j, and l represent 1 mm, and those in panels b, e, h, and k represent 100 μm. (C) Bars in panels a, c, e, and g represent 1 mm, and those in panels b, d, f, and h represent 100 μm.

