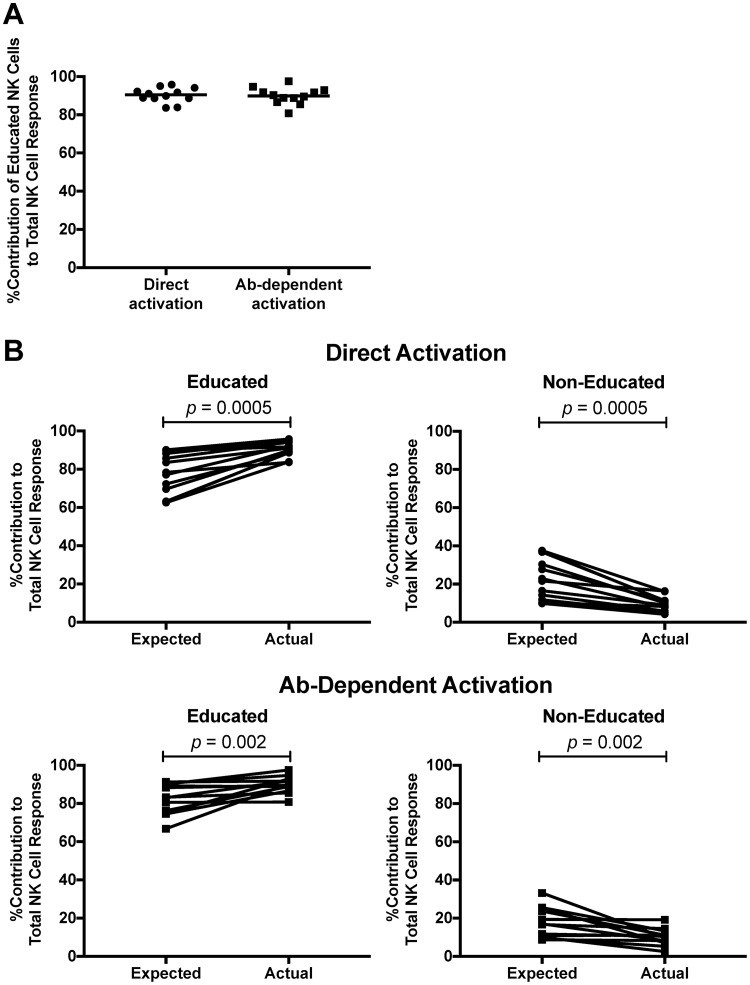
FIG 5.
Contributions of educated and noneducated NK cells to total NK cell response. (A) The graph depicts the percent contribution of educated NK cells to total NK cell activation after direct and antibody-dependent stimulation. Lines indicate medians. (B) The expected contributions of educated and noneducated NK cells to total NK cell activation were calculated as the frequency of these subpopulations within the total NK cell population. The actual contribution was calculated as the frequency of activated educated/noneducated NK cells within the total activated NK cell population. The graphs show the expected and actual percent contributions of educated (left) and noneducated (right) NK cells to the total NK cell response following direct (top) and antibody-dependent (bottom) stimulation. Data were compared using the Wilcoxon matched-pairs test. A P value of <0.05 was considered significant.

