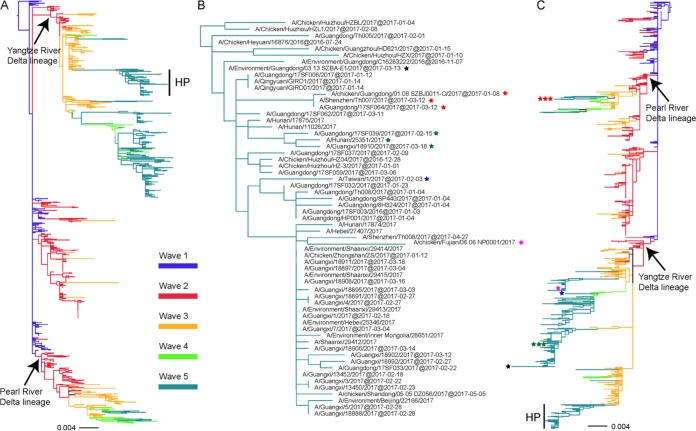
FIG 3.
Phylogenies of HA and NA genes of H7N9 viruses from different waves. All of the H7N9 viruses from waves 1 to 5, including our 35 new isolates, were used to perform the phylogenetic analysis. Panel A shows the HA gene tree, and the HP-H7N9 viruses in panel A were magnified as shown in panel B. Panel C shows the NA gene tree. The HP strains with different NA lineages are marked as stars with different colors in panels B and C; stars with the same color represent the same strain. H7N9 viruses from waves 1, 2, 3, 4, and 5 are colored blue, red, orange, light green, and lime green, respectively.

