FIGURE 2.

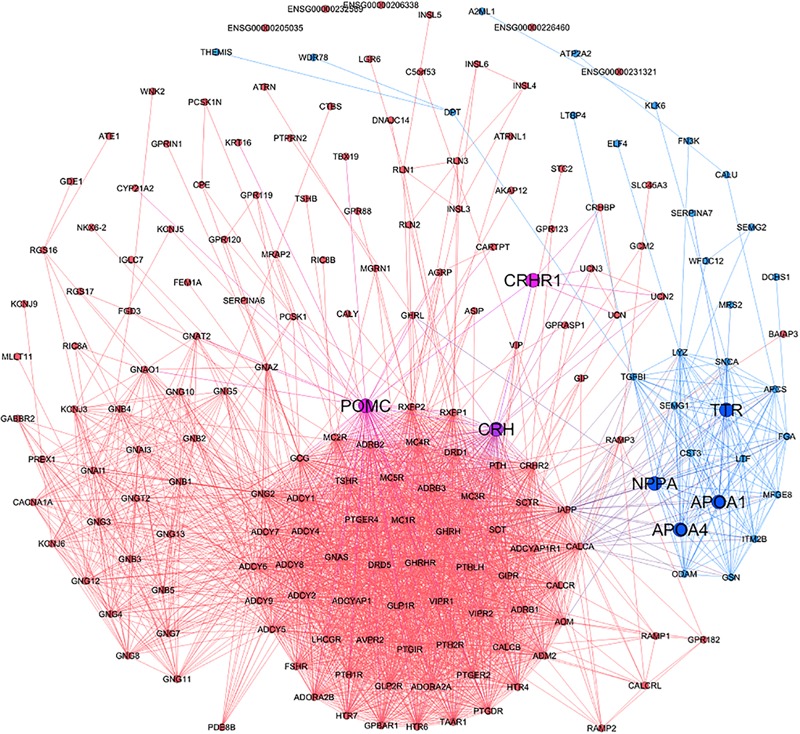
The protein interactions of M146 and M203. The red and blue nodes represent the proteins of M146 and M203, respectively. The red and blue lines represent the protein interactions of M146 and M203, respectively.

The protein interactions of M146 and M203. The red and blue nodes represent the proteins of M146 and M203, respectively. The red and blue lines represent the protein interactions of M146 and M203, respectively.