
Figure 1.
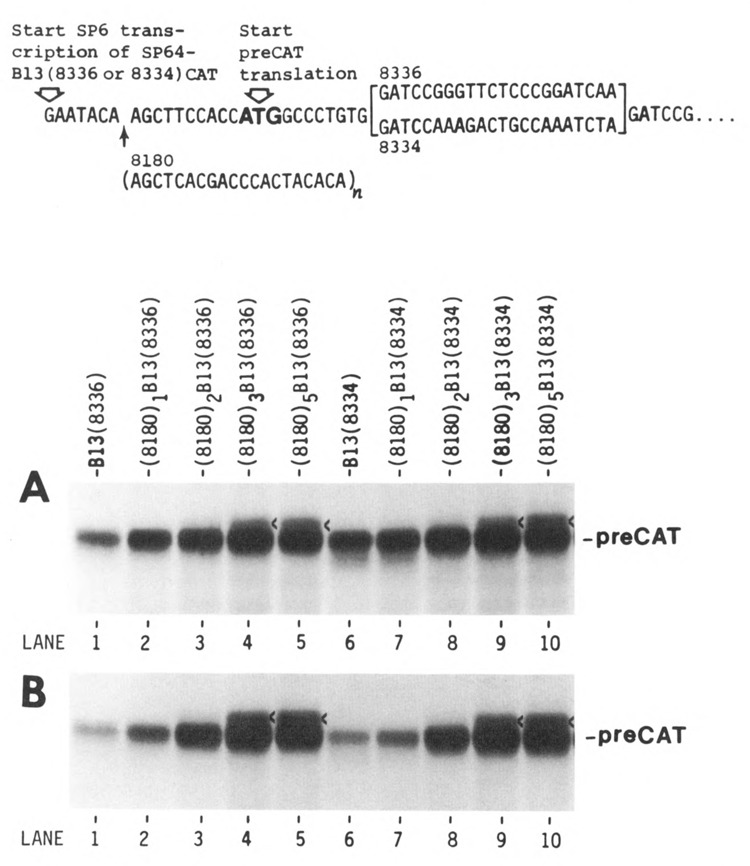
Evaluation of translational efficiency as a function of leader length. Upper. A transcript from the parental plasmid is depicted, with T’s in place of U’s. The preCAT start site is followed by either a structured (8336) or unstructured (8334) adaptor; the sequence downstream from the adaptor was published previously (Kozak, 1989a). The 5′ noncoding sequences on transcripts from the parental plasmids SP64-B13(8336)CAT and SP64-B13(8334)CAT are 17 nucleotides long. Multiples of oligonucleotide 8180, shown below the parental sequence, were inserted at the HindIII site (AAGCTT) to extend the 5′ noncoding sequence in increments of 20 nucleotides. Lower. Autoradiograms are shown of [35S]methionine-labeled proteins synthesized in a reticulocyte translation system under standard salt conditions (A) or with high KCl (B); proteins were fractionated by polyacrylamide gel electrophoresis (Kozak, 1989a). The mRNAs used for translation in panels A and B are indicated above each lane in A. A faint, slower-migrating band in lanes 4, 5, 9, and 10, marked with a caret, is attributable to an upstream ACG codon (see text and Figure 3). The band that runs faster than preCAT in lane 6 reflects a slight degree of leaky scanning (i.e., initiation from the second AUG codon) when the leader sequence is short (Kozak, 1991). Leaky scanning is suppressed by introducing secondary structure downstream (lane 1) or by lengthening the leader sequence (lanes 7–10).