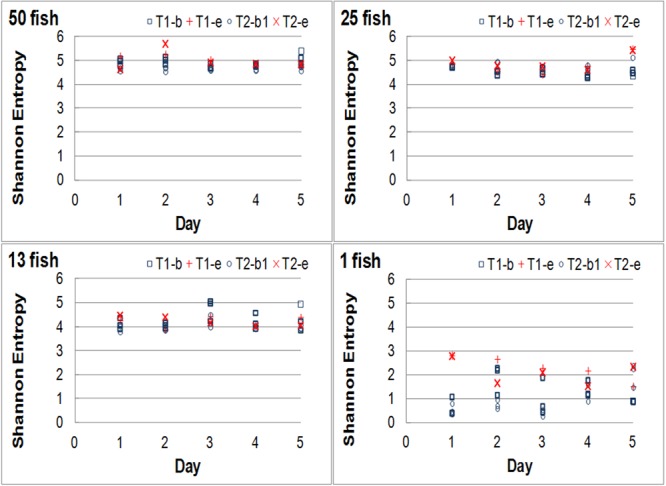
FIGURE 5.

Daily evolution of the Shannon entropy (SE) for Experiment A showing the SE values obtained in tanks 1 and 2 for the basal state (T1-b and T2-b) and in response to the stochastic event (T1-e and T2-e). The number of individuals is indicated on the Top-Left of each plot.
