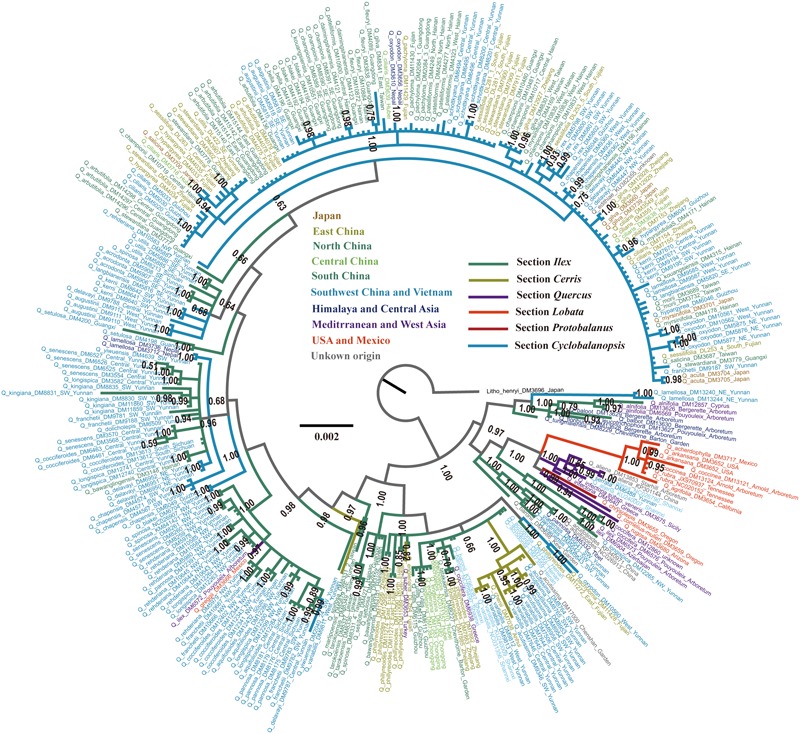
FIGURE 3.

BI phylogram of Quercus inferred using combined cpDNA sequences. The tree was rooted using Lithocarpus henryi as the outgroup. Numbers close to the nodes are posterior probability values. Branch colors indicate different sections and colors of individuals indicate their localities with detail indication in the center of this figure.
