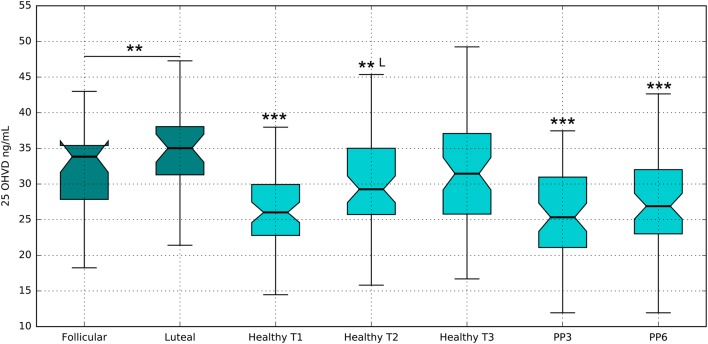
Figure 2.
Serum 25OHD levels of healthy pregnant women compared to non-pregnant women. T1, healthy first trimester; T2, healthy second trimester; T3, healthy third trimester. PP3, postpartum 3 months; PP6, postpartum 6 months. **L, the levels were statistically significant different only with the luteal phase. The other asterisks indicate statistically significant difference for the comparison with both phases of the menstrual cycle **P value <0.01, ***P value <0.001.

 This work is licensed under a