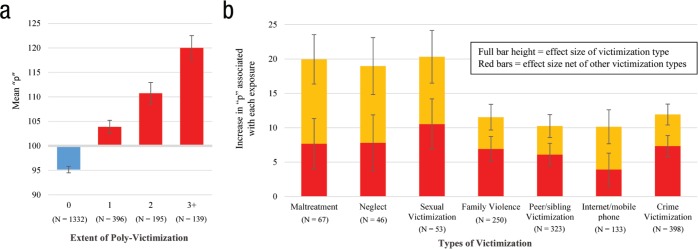
Fig. 2.
Associations between adolescent victimization exposure and early-adult psychopathology (“p”). (a) Mean scores on “p” for Environmental Risk Longitudinal Twin Study (E-Risk) members exposed to 0, 1, 2, or 3+ types of severe adolescent victimization. We scaled “p” to a sample mean of 100 and a standard deviation of 15. (b) Estimates here represent coefficients from separate and simultaneous linear mixed models, which control for clustering by family. These coefficients represent the average difference in “p” between exposed and nonexposed E-Risk members in standardized units where 15 points equals 1 standard deviation. The height of each full bar depicts the effect size of the association between exposure to each victimization type and “p” scores. The height of the red bars depicts the unique association between exposure to each victimization type and “p” scores, while controlling for exposure to each of the other six victimization types. Ns reflect the number of E-Risk members who were exposed to severe forms of each victimization type. Error bars represent 95% confidence intervals. Exact values for these estimates, as well as corresponding 95% confidence intervals and p values, can be found in Table S5 in the Supplemental Material.

