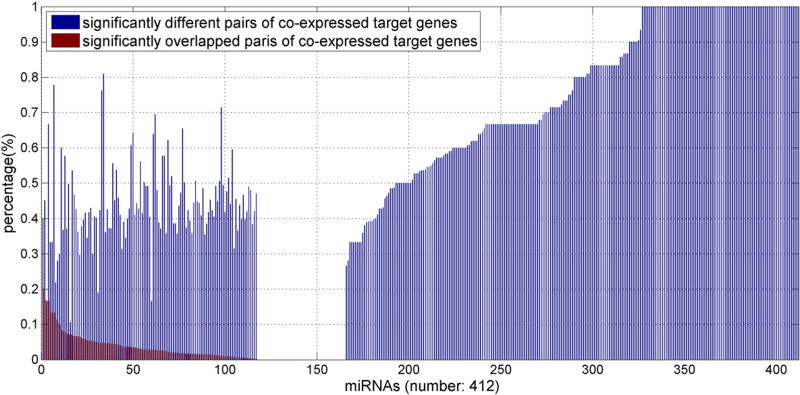
Fig. 2.
The percentage of the number of significantly different (blue bar) and significantly overlapped (red bar) pairs of co-expressed miRNA target gene groups for each of the 412 miRNAs. The miRNAs are sorted according to the percentages of significantly different pairs of miRNA target gene groups from smallest to largest first, then sorted according to the percentage of significantly overlapped pairs of co-expressed miRNA target gene groups.

