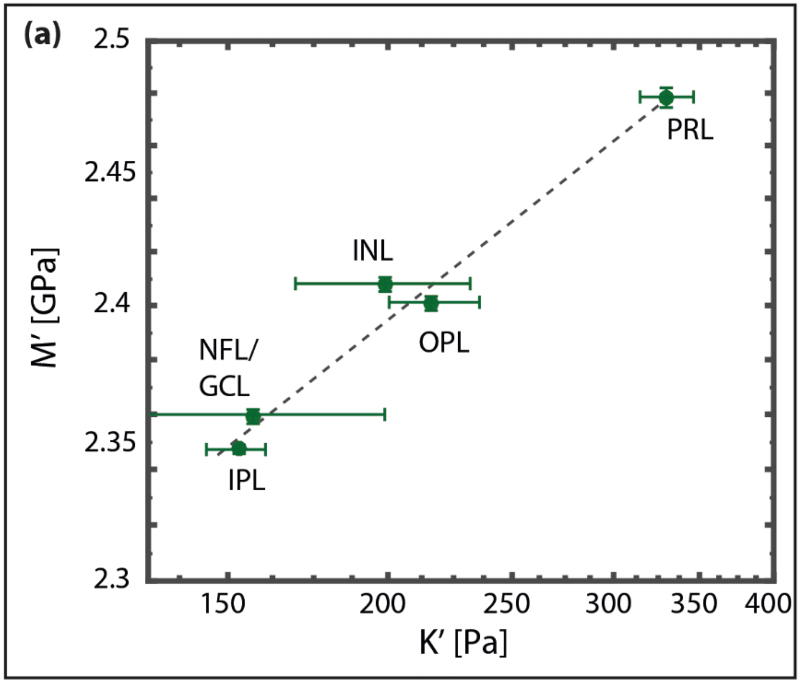
Figure 4. Correlation between elastic moduli obtained by AFM and Brillouin microscopy.
We found a strong correlation in the log-log linear regression between AFM and Brillouin microscopy data (P-value < 0.01; R2 = 0.99), which could be best described by the relationship log(M’) = 0.0678 log(K) + 9.2235. Each dot in the graph corresponds to the median of stiffness values for a defined layer within the retina as measured by AFM and Brillouin microscopy. The error bars indicate the standard error of the median. The dashed line indicates a linear fit on the log-log plot.

