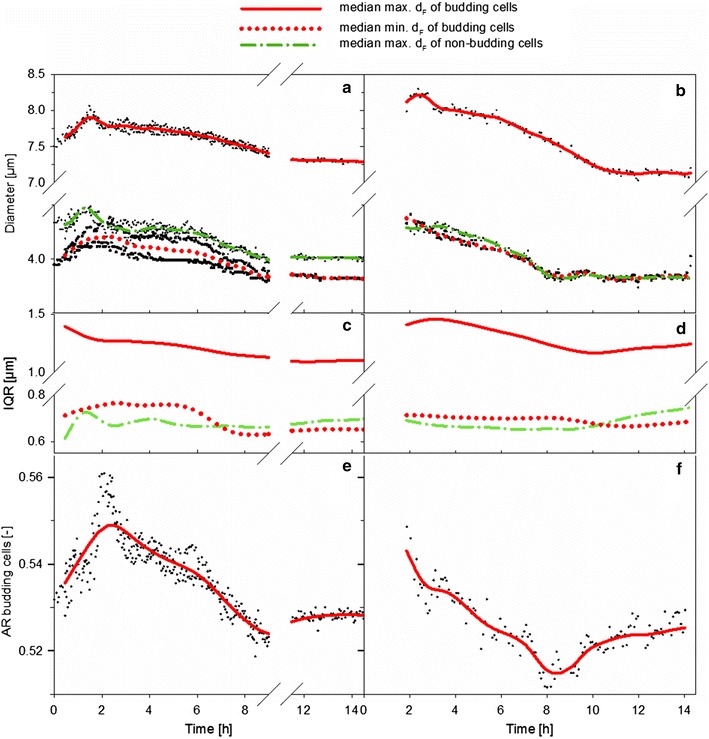
Fig. 8.

Variation of morphological parameters. Values in the left column were obtained with the MM-Ho probe, values at the right column with the MM 2.1 probe. a, b Evolution of the median of the max. dF and the min. dF. c, d Variation of the interquartile range (IQR) of the median of the max. dF and the min. dF. e, f Evolution of the aspect ratio (AR) for budding cells, that is the ratio between the median of the min. dF and the median of the max. dF
