
FIG 3.
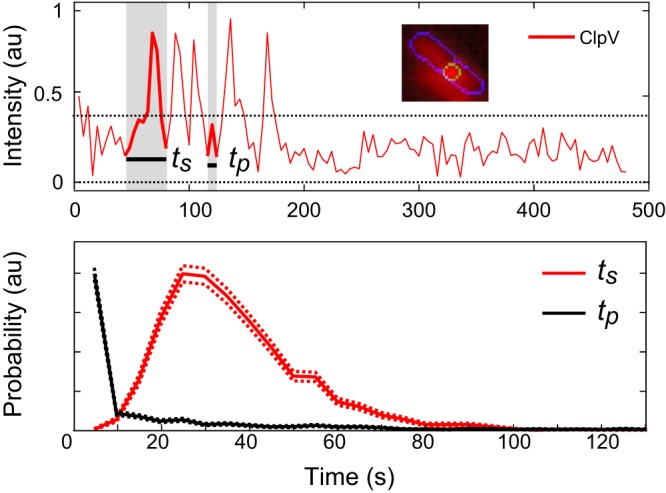
Example data demonstrating measurement of ClpV firing lifetimes (ts) and time between spikes (tp). There are five spikes in this trace. (Top) Representative ClpV firing for a single cell at one focus region. Inset shows image of cell with focus area indicated by outline. Here and in subsequent figures, each trace is representative of one focus area in one cell. (Bottom) Comparisons of ClpV lifetimes. Mean lifetime of the ClpV spike is 37 s, n ≈ 2,200; measurement of time between spikes, n ≈ 1,100.