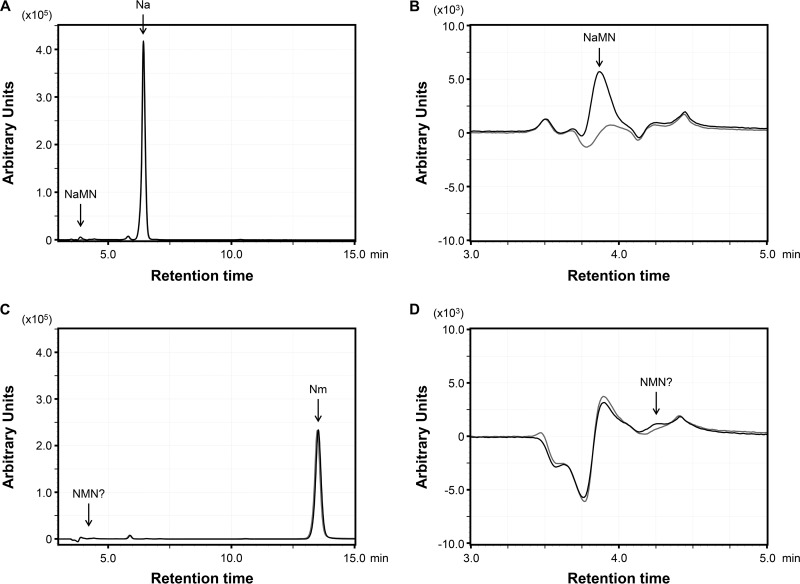
FIG 2.
HPLC analysis of the products obtained after reaction with the TK1676 protein. (A) The reaction was carried out using Na and PRPP as the substrates. (B) Enlargement of the area including the NaMN peak in panel A. (C) The reaction was performed using Nm and PRPP as the substrates. (D) Enlargement of the area in which the standard NMN peak can be detected in panel C. Black and gray lines represent the products of reactions with and without TK1676 protein, respectively.

