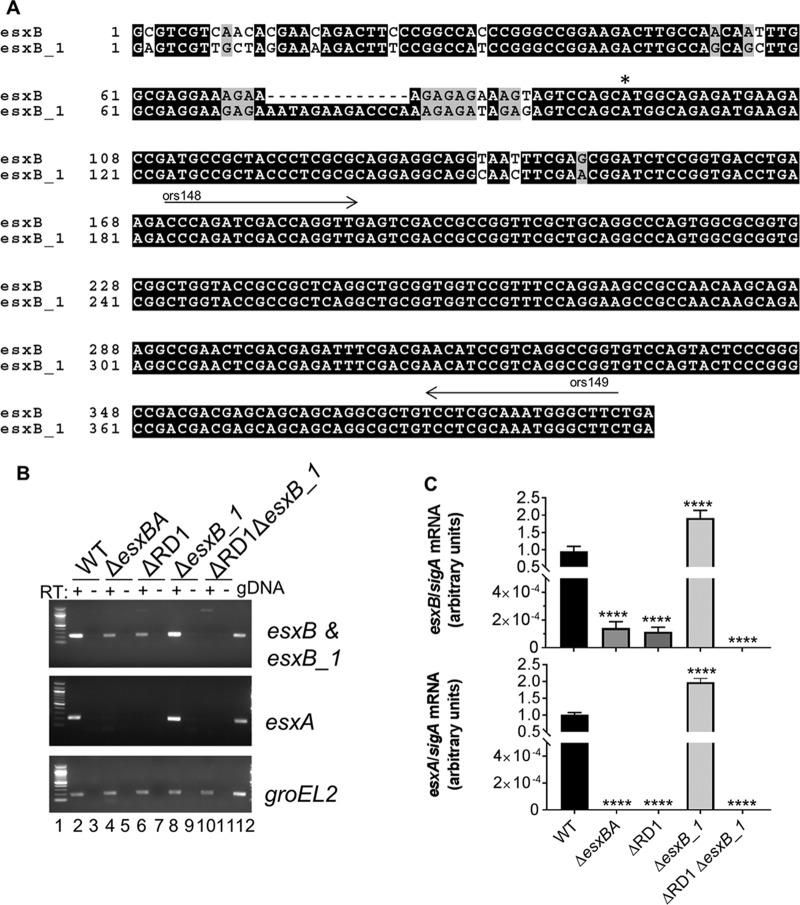
FIG 2.
M. marinum ESX-6 genes share similarities with ESX-1 genes. (A) Alignment of the esxB and esxB_1 genes from M. marinum M. The translational start site is indicated by an asterisk. The arrows indicate the binding sites for ors148 and ors149 primers, which were used for qRT-PCR analysis of the esxB and esxB_1 genes. The alignment was performed using Clustal Omega and visualized using BoxShade. (B) Expression levels of esxB, esxB_1, and esxA were determined using qualitative RT-PCR. RT, reverse transcriptase. The groEL2 gene transcript was a control for cDNA quality. The no-RT control was a control for contaminating genomic DNA (gDNA). The figure is representative of three independent biological replicates. (C) Expression levels of esxB, esxB_1, and esxA determined using quantitative RT-PCR. esxB, esxB_1, and esxA transcripts were normalized relative to the level of the sigA gene. Error bars represent standard deviations of four technical replicates performed on two biological replicates (n = 8). Significance relative to the WT strain was determined using a one-way ANOVA (P < 0.0001) followed by a Dunnett's multiple-comparison test. (****, P ≤ 0.0001).

