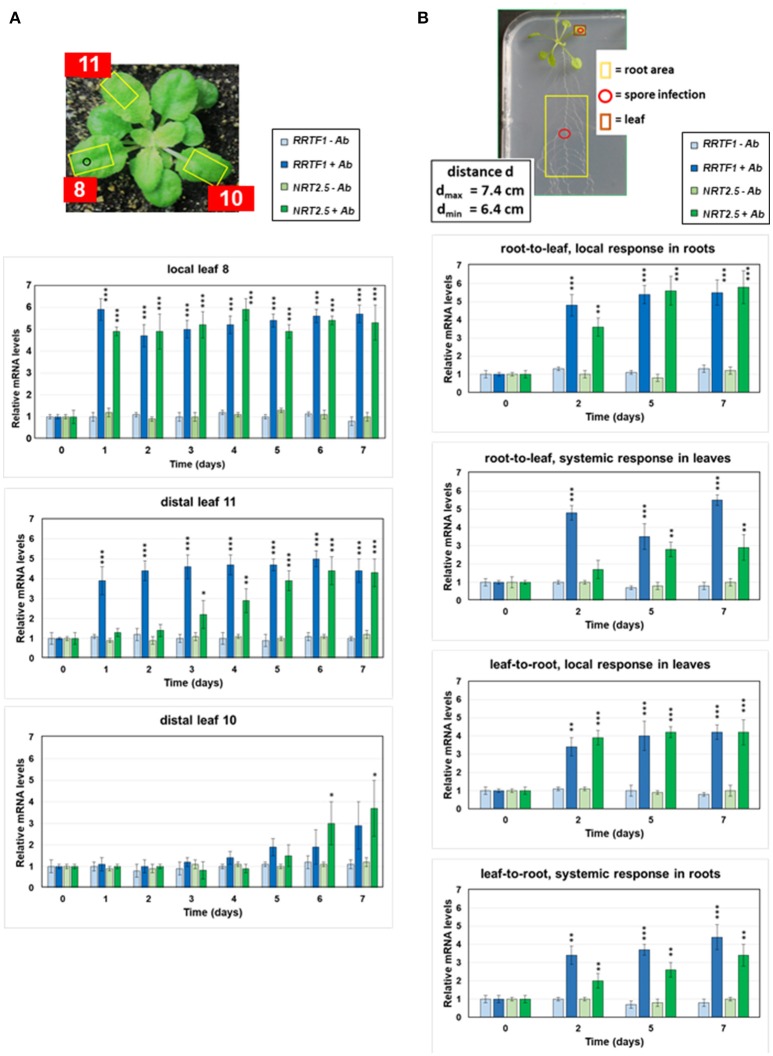
Figure 1.
Local and systemic induction of RRTF1 (blue bars) and NRT2.5 (green bars) mRNA levels by A. brassicae spore infection. (A) The picture shows the experimental set-up. The leaf numbers of 4-week-old seedlings, the A. brassicae infection area (o) and the sections used for RNA extraction (yellow squares) are shown. RRTF1 and NRT2.5 mRNA levels in the local infected leaf no. 8 and the distal leaves no. 11 and 10. At day 0, infection was performed with an A. brassicae spore suspension and the mRNA accumulation was followed in infected (darker bars) and mock (water)-treated (lighter bars) seedlings over a period of 7 days. (B) The picture shows 2-week-old Arabidopsis seedlings grown in square Petri dishes for the measurements of RRTF1 and NRT2.5 mRNA levels in local and systemic tissues. The spore infection occurred either at the leaf or at the root (red o). The local and systemic leaf areas harvested for RNA isolation are indicated (red and yellow squares). The graphs show RRTF1 (blue bars) and NRT2.5 (green bars) mRNA levels in local and systemic tissues 0, 2, 5, and 7 days after application of an A. brassicae spore suspension (darker bars), lighter bars show water controls. All RNA data are based on 6 independent experiments with 10 seedlings for each treatment. The mRNA levels for the 4 datasets at day 0 were set as 1.0 and all other values were expressed relative to them (±SEs). Asterisks indicate significant differences of the values for Alternaria-treated tissue compared to the corresponding water control at the same time point, as determined by Student's t-test (*P ≤ 0.1; **P ≤ 0.01; ***P ≤ 0.001). *** >, all higher values have P ≤ 0.001 compared to mock-treated controls.

