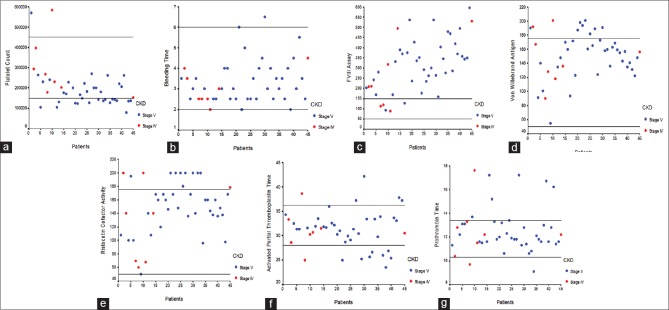
Figure 2.
Distribution of hemostatic test abnormalities in the study population. (a) Platelet count expressed per mm3 (horizontal bars represent normal range of values). (b) Bleeding time in minutes (horizontal bars represent normal range of values). (c) Factor VIII concentration in IU (horizontal bars represent normal range of values). (d) von Willebrand Antigen concentration in U/dl (horizontal bars represent normal range of values). (e) Ristocetin cofactor activity in % (horizontal bars represent normal range of values). (f) Activated partial thromboplastin time in seconds (horizontal bars represent normal range of values). (g) Prothrombin time in seconds (horizontal bars represent normal range of values)

