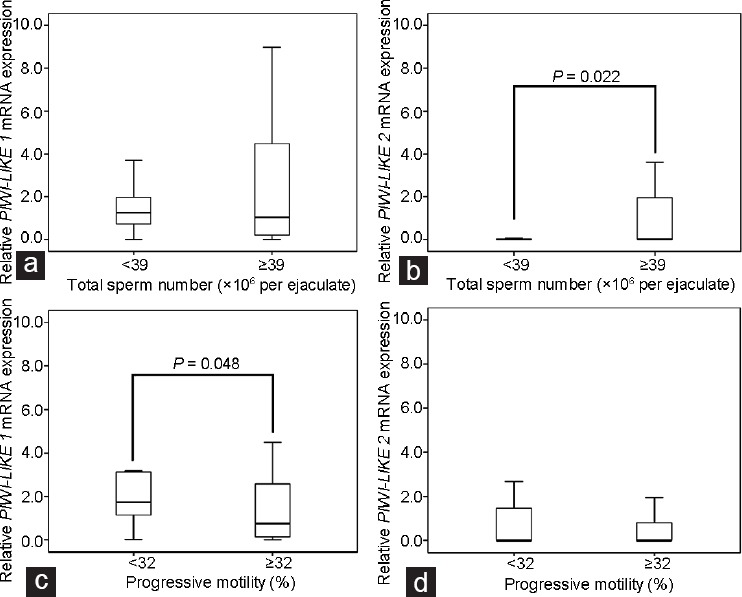
Figure 1.

Box-plots comparing the relative mRNA expression of the PIWI-LIKE 1 and PIWI-LIKE 2 (expressed in Δ CT values) in ejaculated spermatozoa stratified to total sperm count and progressive motility. While (a) PIWI-LIKE 1 expression was not associated with sperm count, (b) samples from patients with oligozoospermia (<39 × 106 spermatozoa per ejaculate; n = 26) exhibited a decreased PIWI-LIKE 2 mRNA expression in comparison with normozoospermia (≥39 × 106 spermatozoa per ejaculate; n = 57, P = 0.022, Mann–Whitney U-test). (c) Samples from patients with asthenozoospermia (<32%; n = 23) exhibited an increased PIWI-LIKE 1 mRNA expression compared with normozoospermic patients (≥32%; n = 60; P = 0.048, Mann–Whitney U-test), while (d) PIWI-LIKE 2 mRNA expression was not associated with motility. Note the different y-axis scales indicating the higher expression of PIWI-LIKE 1 mRNA in comparison to PIWI-LIKE 2 mRNA. The boxes designate the distribution of 50% of the measured values; the lines designate the median value. The whiskers define the 2.5% and 97.5% quantiles.
