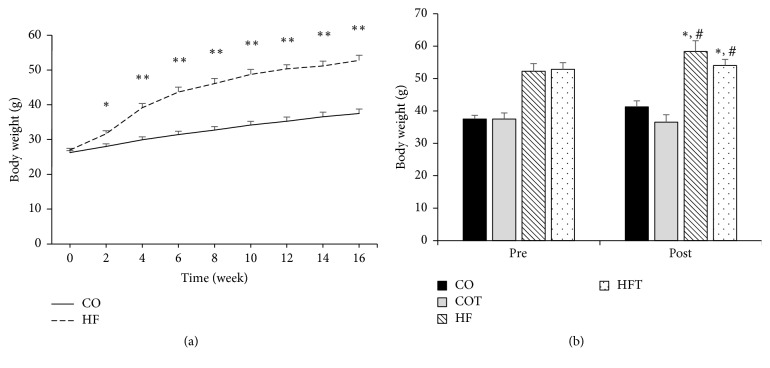
Figure 1.
Changes in body weight. Changes in body weight during the obesity-induction period (a) and before and after the eight-week training programme (b). Data are expressed as mean ± SE. CO: normal-diet group, COT: normal-diet + training group, HF: high-fat diet group, and HFT: high-fat diet + training group. ∗ versus CO, p < 0.05; ∗∗ versus CO, p < 0.001; #; versus COT, p < 0.05.

