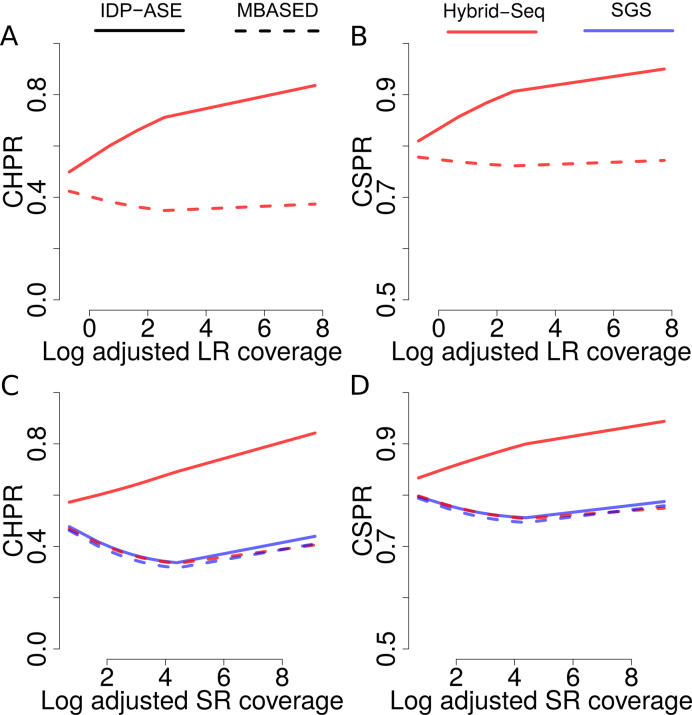
Figure 3.
Influence of sequencing coverage on haplotyping. (A–D) Average CHPR and CSPR versus the log of adjusted long reads coverage (A and B) and the log of adjusted short reads coverage (C and D). Genes are grouped by the 10 percentiles of the log adjusted coverage and a smooth loess curve is fit to the data. Red and blue colors indicate Hybrid-Seq data and SGS-only data, respectively. Solid and dashed lines indicate IDP-ASE and MBASED, respectively.

