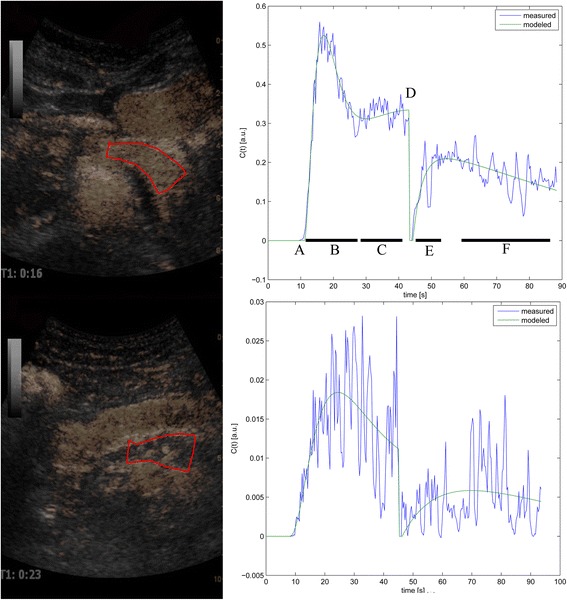
Fig. 1.

Analysis and perfusion curves. The figure displays contrast images from with a chosen region of interest (Red encirclement) in the body/tail of the pancreas in a sufficient (upper) and insufficient (lower) CF patient. The ROIs were placed by guidance from the B-mode image. Mark that the ROI in the insufficient patient is placed over an atrophic and poorly perfused pancreas. The highly perfused structure anterior to the pancreas is the ventricular wall. The perfusion curves with different phases are presented to the right the measured (blue) and modelled (green) curves. A: Arrival of contrast. B: First pass of contrast bolus. C/F: Linear decay phases. D: Burst. E: replenishment phase. Curves are presented before scaling to the arterial input, thus values are in arbitrary units and not directly comparable. (C(t): Concentration over time. [a.u]: Arbitrary units
