
Figure 6. Decreased levels of SPCA1 impair viral spread and production of infectious particles.
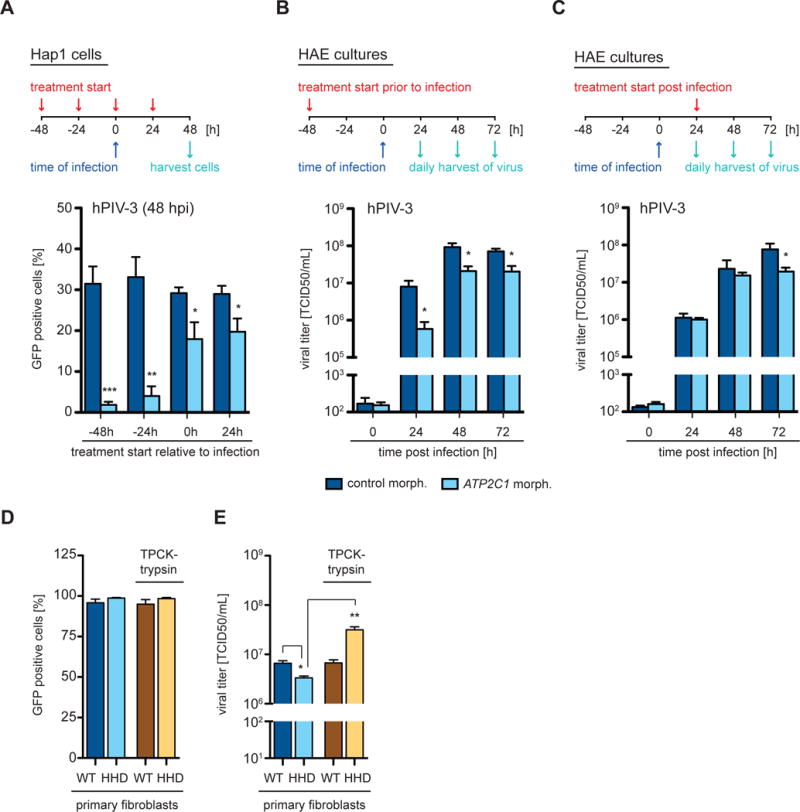
(A) Hap1 cells and (B and C) primary human airway epithelial (HAE) cultures were treated with a control Morpholino or a Morpholino targeting ATP2C1 at a concentration of (A) 5 μM and (B and C) 20 μM. The experiments are outlined schematically above graphs indicating treatment start relative to infection - (A) pre-treatment and post-treatment; (B) pre-treatment; and (C) post-treatment. Infections were performed with hPIV-3-GFP viruses at a MOI of (A) 0.01 and (B and C) 0.1. (A) Cells were harvested at 48 hpi, analyzed by flow cytometry and plotted as a percentage of GFP positive cells. Data represent the mean and SD of 3 independent experiments. (B and C) The cultures were washed daily with PBS to harvest the released virus, which was subsequently titered by TCID50 assay. Data represent the mean and SD of 3 independent experiments. (D and E) Primary fibroblasts derived from healthy control individuals (C1, C2, C3, C4) and HHD patients (H1, H2, H3, H4) were infected with hPIV-3-GFP at a MOI of 4 in the presence or absence of TPCK-trypsin. Cells and supernatants were harvested at 24 hpi. (D) Cells were analyzed by flow cytometry and the average of control fibroblasts (WT) and HHD fibroblasts (HHD) plotted as a percentage of GFP positive cells. (E) Supernatants were titered by TCID50 assay and the average of control fibroblasts (WT) and HHD fibroblasts (HHD) plotted as indicated. Data represent the mean and SD of 3 independent experiments of 4 biological replicates. Statistical analysis was performed with a 2-tailed Student t-test and significance is stated with: * p≤0.05, ** p≤0.005 and *** p≤0.0005. See also Figure S6.