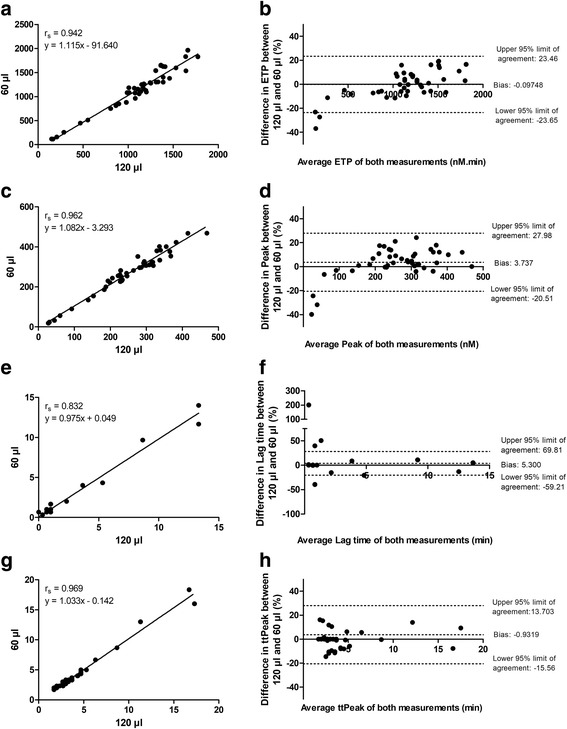
Fig. 1.

Correlation and Bland-Altman plots of thrombin generation parameters in MidiCAT and regular CAT. The correlation between the MidiCAT (60 μl final volume) and the regular CAT (120 μl final volume) was determined for the four main CAT parameters i.e. a endogenous thrombin potential (ETP), (c) peak, (e) lag time and (g) time-to-peak (ttPeak) in 43 healthy donors using 5 pM tissue factor (measured in duplicate). The Spearman correlation coefficient is indicated. Bland-Altman plots were constructed analyzing the percentage difference of the two methods (100*(A-B)/average) versus the average ((A + B)/2) of the two methods. Method A was the MidiCAT and method B was the regular CAT. Plots were prepared for (b) ETP, (d) peak, (f) lag time and (h) ttPeak. For all analyses 43 subjects were measured. Of note, for the lag time and time-to-peak several subjects had the same result, because of which it seems that less dots are depicted in the graphs
