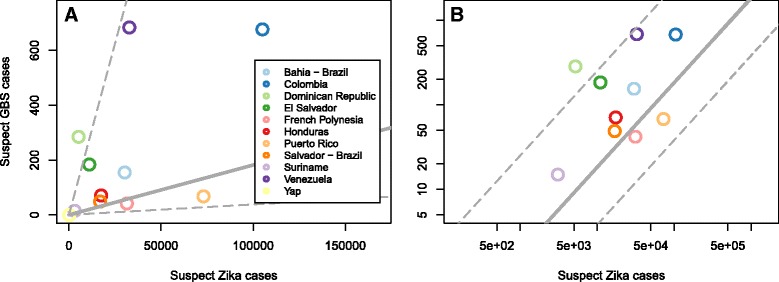
Fig. 1.

Suspect GBS and Zika case data at the 11 locations that we consider on a linear scale (a) and a log-log scale (b); note that Yap is missing from panel ‘b’ because no GBS cases were detected there. Using the raw GBS and case data (a) there is a positive though not statistically significant correlation of 0.54 (Pearson correlation, 95% confidence interval −0.08 to 0.86). The model, however, considered the uncertainty and variability in these observations and showed a significant relationship indicated by grey lines for the estimated median number of reported suspect GBS cases for a given number of reported suspect Zika cases in an unspecified location (solid) and the 95% credible interval of that estimate (dashed)
