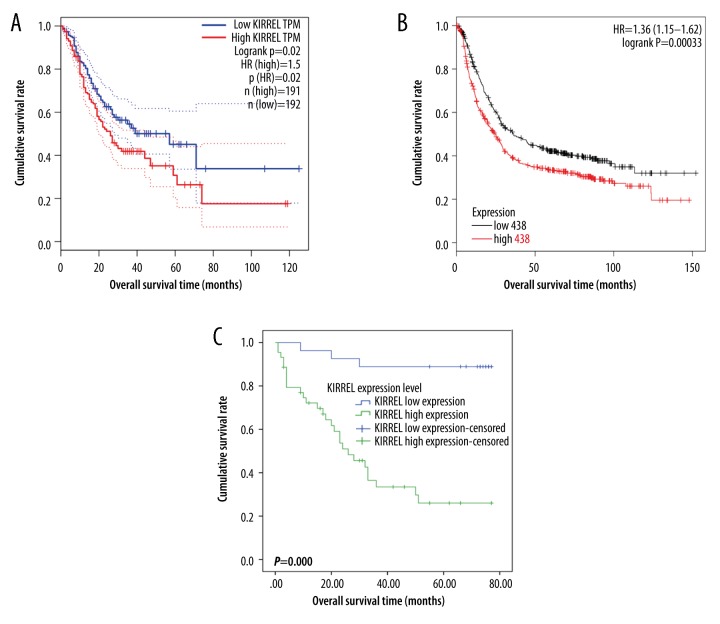
Figure 4.
Overall survival (OS) curves of gastric cancer patients based on the differential expression levels KIRREL mRNA or protein (low vs. high). (A) OS curve based on TCGA data; (B) OS curve based on GEO data (analyzed in Kaplan-Meier Plotter website); (C) OS curve based on the immunohistochemical data.

