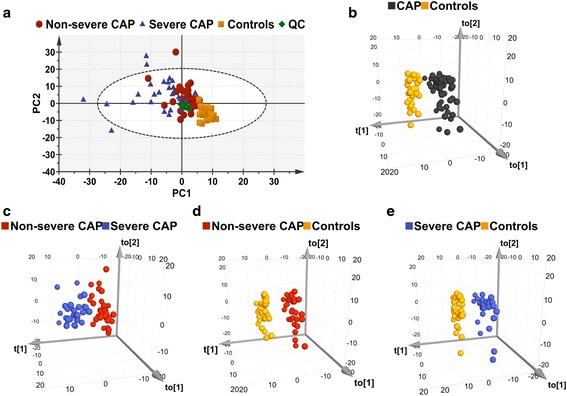
Fig. 2.

Multivariate statistical analysis of serum samples in discovery cohort. a PCA score plots. Five samples (four severe CAP and one non-severe CAP) are placed outside the ellipse that describes the 95% CI of Hotelling’s T-squared distribution. b OPLS-DA three-dimensional score plot discriminates all CAP subjects versus controls in discovery cohort (R2Y = 0.937, Q2 = 0.814, p < 0.0001). c OPLS-DA score plots of non-severe CAP versus severe CAP groups (R2Y = 0.757, Q2 = 0.465, p < 0.0001). d OPLS-DA score plots of non-severe CAP patients versus controls (R2Y = 0.994, Q2 = 0.955, p < 0.0001). e OPLS-DA score plots of severe CAP patients versus controls (R2Y = 0.996, Q2 = 0.854, p < 0.0001). R2Y represents goodness of fit, Q2 represents goodness of prediction, p value shows significance level of the model. CAP community-acquired pneumonia, PC principal component, QC quality control
