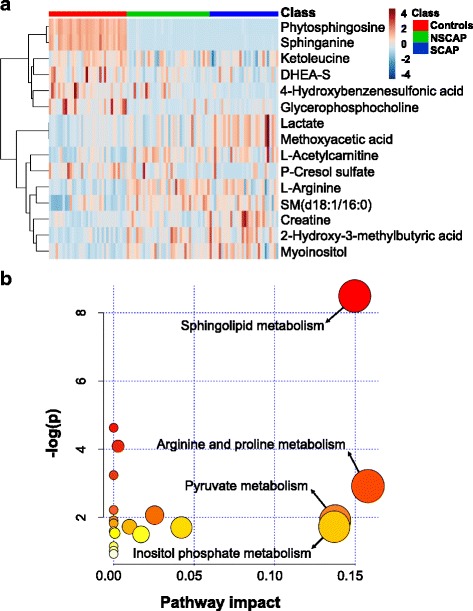
Fig. 3.

Fifteen metabolites dysregulated in CAP compared to controls. a Hierarchical cluster heatmap of 15 metabolites in three groups. Row represents metabolites and column represents individual samples. Green, red and blue represent non-severe CAP (NSCAP), severe CAP (SCAP) and controls, respectively. Greater brown indicates higher relative intensity of metabolites, while light blue indicates lower intensity. b Metabolic pathway analysis of 15 metabolites changed in CAP. Node colour based on p value and node radius determined based on pathway impact values. CAP community-acquired pneumonia, DHEA-S dehydroepiandrosterone sulfate
