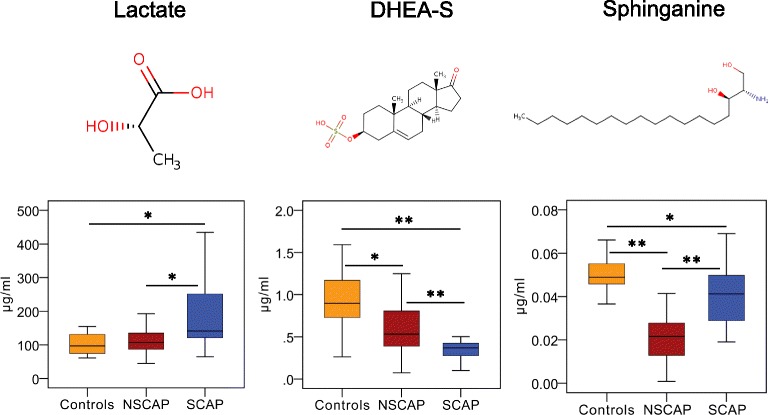
Fig. 4.

Three metabolites identified that can discriminate severe CAP from non-severe CAP in validation cohort. Chemical structures of three metabolites. Box–whisker plots of concentrations of three metabolites in three groups. Horizontal line represents median; bottom and the top of box represent 25th and the 75th percentiles; whiskers represent 5% and 95% percentiles. *p < 0.01, **p < 0.001. CAP community-acquired pneumonia, DHEA-S dehydroepiandrosterone sulfate, NSCAP non-severe CAP, SCAP severe CAP
