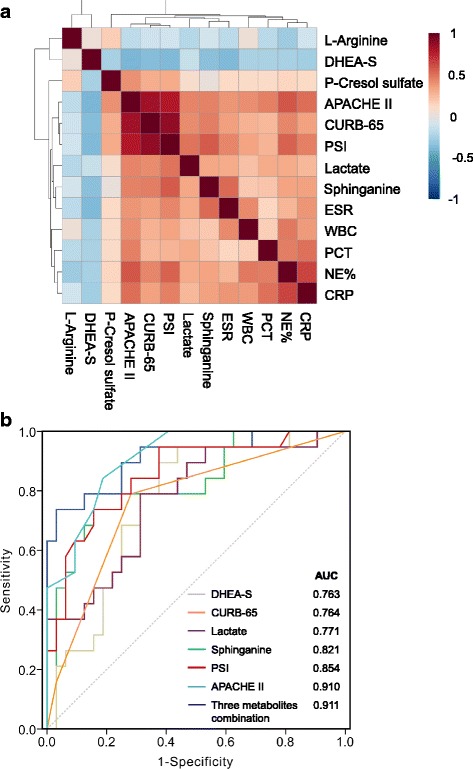
Fig. 5.

Correlations of five metabolites with clinical parameters and assessment performance. a Pearson’s correlation heatmap of five serum metabolites and clinical parameters. Greater intensities of brown and blue indicate higher positive or negative correlations, respectively. Resulting correlation matrix presented in Additional file 3: Table S6. b ROC curve analysis of various parameters for discrimination of severe CAP from non-severe CAP. DHEA-S dehydroepiandrosterone sulfate, APACHE II Acute Physiology and Chronic Health Evaluation II, CURB-65 confusion, urea level, respiratory rate, blood pressure, and > 65 years, PSI pneumonia severity index, ESR erythrocyte sedimentation rate, WBC white blood cell, PCT procalcitonin, NE% percentage of neutrophils, CRP C-reactive protein, AUC area under the curve
