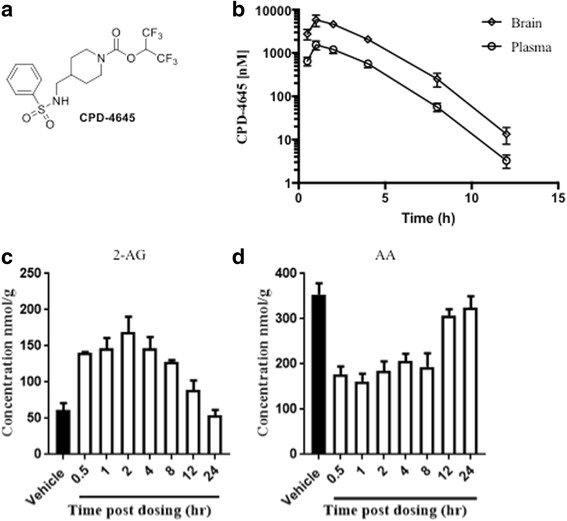
Fig. 2.

Pharmacokinetic and pharmacodynamic profiling of CPD-4645 in naïve mouse brain. a Structure of the 2-AG hydrolysis inhibitor CPD-4645. Total CPD-4645 concentrations in brain and plasma (b) and bulk levels of brain 2-AG (c) and AA (d) at given time points following single 10 mg/kg subcutaneous dose of CPD-4645 in CD1 mice. Data are means ± SEM, n = 3/5 mice per group
