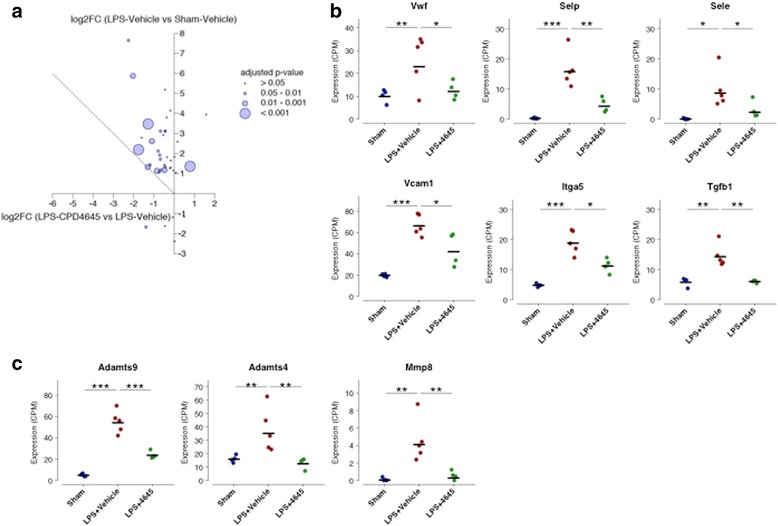
Fig. 5.

Genes related to BBB (dys) function and proteases are differentially expressed after LPS challenge and treatment with CPD-4645. a Changes in the expression of 40 genes related to BBB function and dysfunction. The y-axis represents the log2-fold change due to LPS challenge while the x-axis represents the log2-fold change due to CPD-4645 treatment. Dotted line represents a return to basal expression level. Size of the bubbles represents the multiple comparison adjusted p values for vehicle vs. CPD-4645 treatment. b Expression levels of selected BBB genes. c Expression levels of selected extracellular proteases. n = 4–5 mice/group. Significance is shown as adjusted p values *p ≤ 0.05, **p < 0.01, *** p < 0.001. Differential gene expression was analyzed using the limma package in R/Bioconductor (see Methods)
