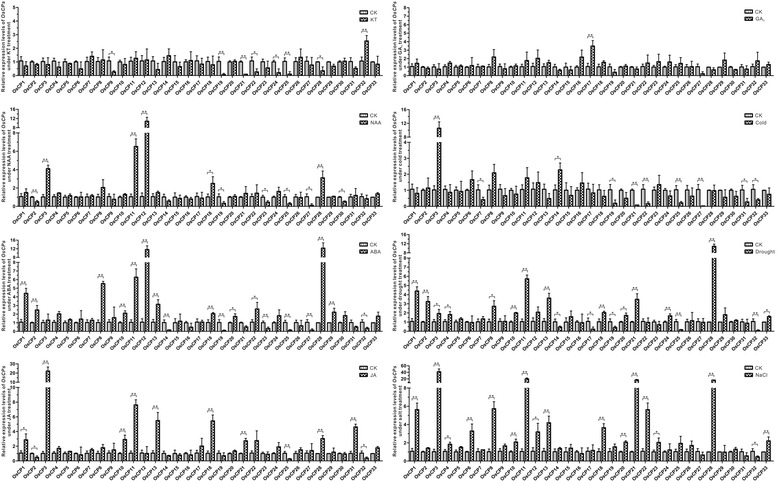
Fig. 8.

Expression levels of OsCPs in seedlings under different hormone and abiotic treatments. The expression was normalized against OsActin and OsUBC. The data represent the relative expression level compared with that in seedlings under normal growth conditions and bars indicate the standard deviation of with three independent repetitions. ‘*’ and ‘**’ indicate statistical difference compared to the WT (t-test, p < 0.05 or 0.01, respectively)
