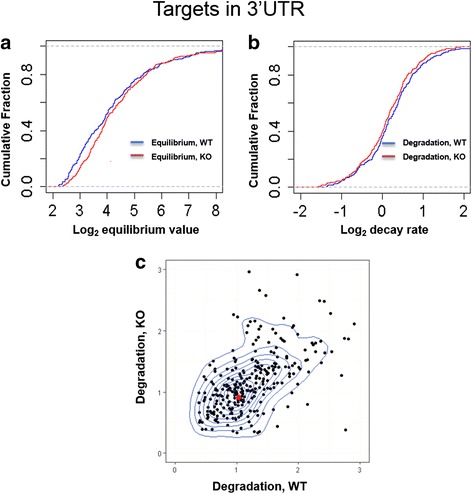
Fig. 2.

Distribution of the equilibrium expression and degradation change of 3’UTR targets between miR310s WT and KO. Targets’ degradation rates were normalized by the mode of the background decay rate. The median of equilibrium expression value is 15.3 for WT and 16.3 for KO. The degradation rate median value is 1.16 for WT and 1.11 for KO. (a) The cumulative distribution of equilibrium expression change. (b) The cumulative distribution of degradation change. (c) The contour distribution of miR310s targets’ degradation between WT and KO. Here, we performed a 2D kernel density estimation with an axis-aligned bivariate normal kernel, evaluated on a square grid and displaying the results with contours. The line indicates the contour estimated by the density of points. The red dot marks the densest point (1.04, 0.91). Strongly modulated target genes tend to be in the “high” or “long” group, which account for > 80% of the outliers
