
Fig. 2.
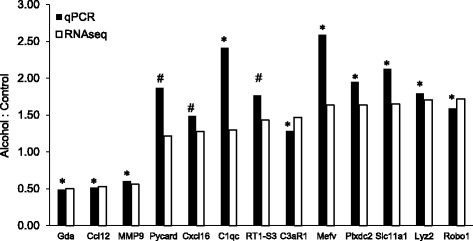
Validation of RNAseq results. Reverse transcriptase quantitative PCR (qPCR) was used to measure mRNA levels of the indicated Alc-DEs. qPCR was carried out in samples from microglia incubated for 24 h with nothing (control, n = 3) or 75 mM ethanol (n = 3), and results normalized to values measured for β-actin in the same samples. The y-axis shows the ratio of the average mRNA level measured in the ethanol versus the control samples (filled bars) and is plotted next to the fold-difference calculated from RNAseq data (open bars). For qPCR results, *P < 0.05; #P < 0.10 control vs alcohol. For the RNAseq data, all DEs were found significantly different using Deseq2