
FIGURE 1.
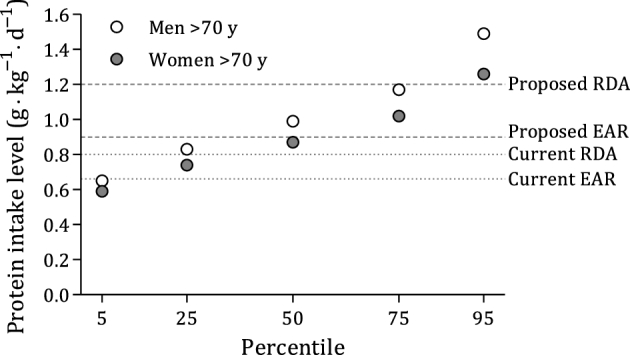
Mean amount of dietary protein expressed according to ideal body weight among men (n = 324) and women (n = 281) aged >70 y. Data were derived from NHANES 2005–2006, as published by Berner et al. (7). Horizontal dotted lines indicate the current EAR and RDA, and dashed lines indicate the proposed EAR (0.9 g · kg−1 · d−1) and RDA (1.2 g · kg−1 · d−1) based on values from Table 1. The data indicated that 6% of men aged >70 y and 12% of women aged >70 y consumed less protein than the current EAR (0.66 g · kg−1 · d−1). EAR, Estimated Average Requirement.