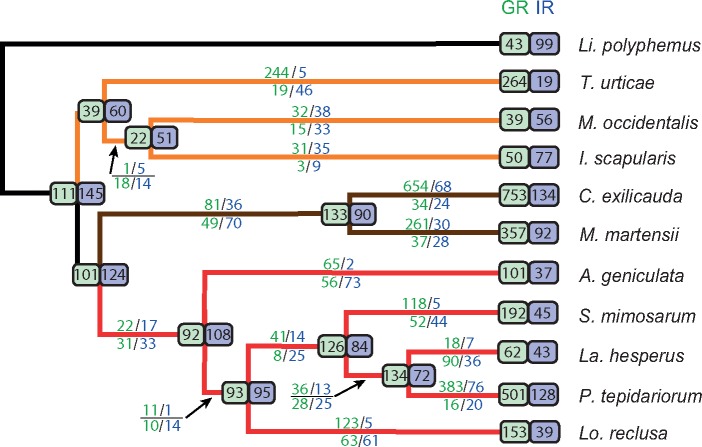
Fig. 6.—
Gene turnover of chemoreceptors across chelicerates. Estimates obtained from the data set used to estimate SMIN. Numbers above and below each branch indicate lineage-specific gene duplications and losses, respectively. Green, GR family; blue, IR/iGluR family. Estimates in very short and outgroup branches have large uncertainty and are not showed. Numbers in the ancestral nodes show the estimated family sizes. Numbers at the tips indicate the number of sequences used for the analysis; such values can differ from SMIN because only sequences that clustered in an orthogroup (with three or more sequences) were included in the analysis.

