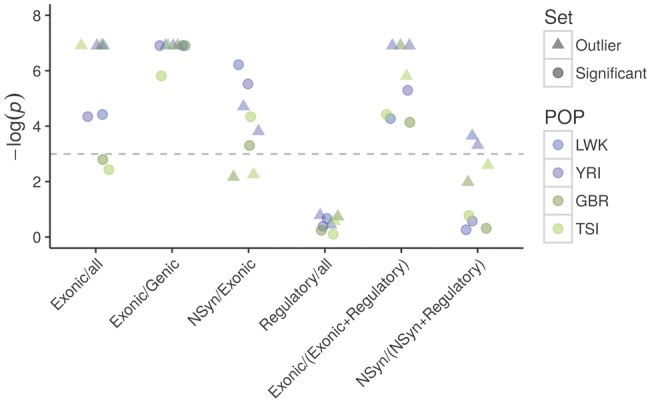
Fig. 5.

—Enrichment of classes of sites among candidate windows. Dashed lines mark the P = 0.975 (bottom) and P = 0.025 (top) thresholds for the one-tailed P values (hypothesis: enrichment). NSyn, nonsynonymous; all, Genic + Intergenic + Regulatory. The annotation is based on Ensembl variant predictor (supplementary information S4, Supplementary Material online). P< 0.001 was treated as 0.001 to avoid infinite values.
