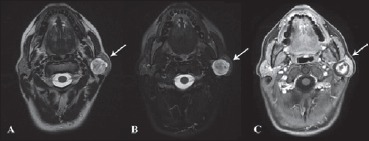
Fig. 1.

Axial MRI scan: A) T2 FrFSE (Fast Relaxation Fast Spin Echo), B) FrFSE FAT SAT (Fast Relaxation Fast Spin Echo Fat Saturation) and C) T1 with contrast medium. In all scans the arrows show a mass with more cellular central portion (with a good enhancement after contrast medium) opposite to a more mixoid peripheral component.
