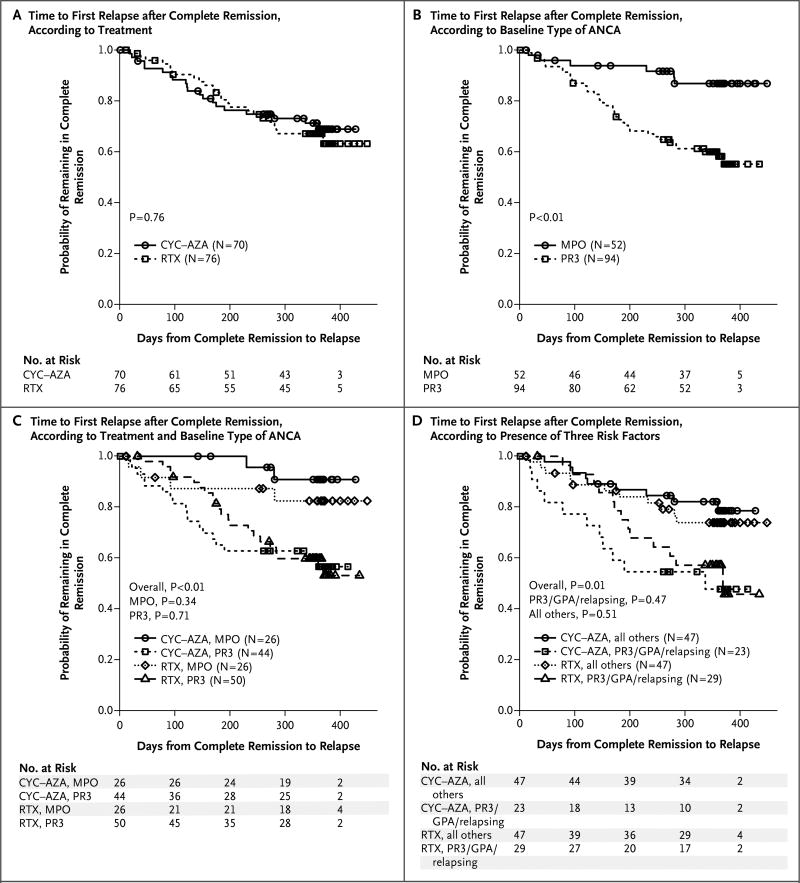
Figure 2. Kaplan–Meier Plots of the Risk of Disease Relapse after Complete Remission.
Panel A shows the time to the first disease relapse after complete remission according to treatment group (rituximab [RTX] or cyclophosphamide–azathioprine [CYC–AZA]). Panel B shows the time to the first disease relapse after complete remission according to baseline type of antineutrophil cytoplasmic antibody (ANCA) (proteinase 3–ANCA [PR3] or myeloperoxidase-ANCA [MPO]). Panel C shows the time to the first disease relapse after complete remission according to baseline type of ANCA in each treatment group. Panel D shows the time to the first disease relapse after complete remission among patients with a diagnosis of granulomatosis with polyangiitis (GPA) who were also positive for proteinase 3–ANCA and had a severe relapse at baseline, as compared with all other patients in each treatment group. In Panels C and D, the overall P values are for the comparison of the four patient groups, whereas the other P values are for the comparisons between the two treatment groups within each defined patient subgroup. For additional details, see https://www.itntrialshare.org/RAVE18mos/Fig2.html.

