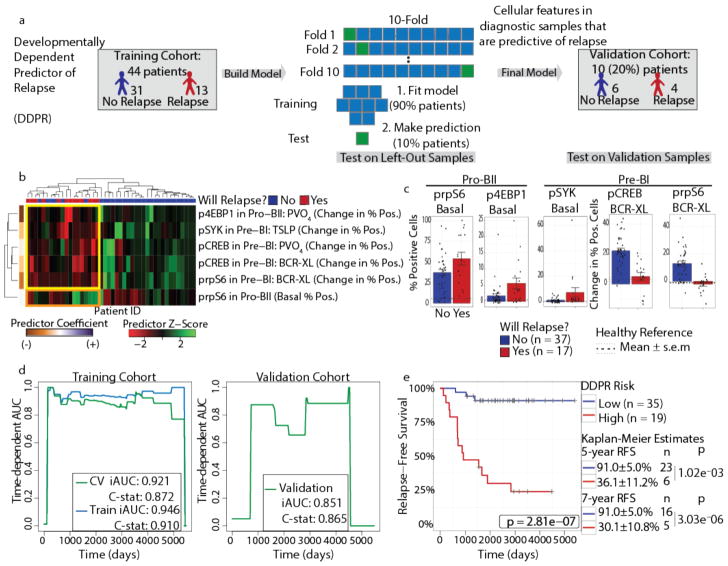
Figure 4. DDPR predicts which patients will go on to relapse based on features of expanded BCP-ALL populations at diagnosis.
(a) Construction of the Developmentally Dependent Predictor of Relapse (DDPR) model that predicts relapse in BCP-ALL. Data from 54 patients with ≥3 years of follow-up were divided into training (n = 44) and validation (n = 10) cohorts. Cellular features available to DDPR included signaling in the basal state, changes in signaling state following perturbations, mean arsinh-transformed expression of surface and intracellular proteins, and frequency of cells in the expanded developmental populations. DDPR performance was estimated using 10-fold cross-validation (CV) within the training cohort to yield pre-validated relative risk for each patient. The final DDPR model (elastic net-regularized Cox model) was then built using all training cohort samples. Once constructed, DDPR was applied to predict relative risk for samples in the validation cohort. (b) Hierarchical clustering of 6 predictive features of relapse identified by DDPR within the training cohort. The last documented relapse status is shown above the heatmap as relapse (red) or continuous complete remission (blue). Coefficients of predictors are shown on the left of the heatmap. Yellow box indicates 5 features with negative correlation to relapse. Orange box indicates 1 feature with positive correlation to relapse. (c) Bar plots show mean ± s.e.m of key DDPR cellular features in pro-BII and pre-BI cells in all patients (n = 54); p-values are not shown, because these features were selected to be different and non-redundant between classes (unpaired two-tailed Welch’s t test from left to right would yield: p = 0.055, p = 0.044, p = 0.13, p = 5.7×10⁻⁶, p = 1.6×10⁻⁷). Dashed lines indicate mean levels in the corresponding developmental populations within healthy bone marrow aspirates of 5 healthy donors; dotted lines indicate standard error. (d) Time-dependent AUC curves showing performance for relapse prediction in the training (left) and validation (right) cohorts. Integrated dynamic/cumulative AUC (iAUC) and C-statistic (C-stat) summary measures are shown for each curve built using pre-validated (green, left), overall model fit (blue, left), and predicted (green, right) relative risk of relapse with reference to the sample average. (e) Kaplan-Meier analysis of relapse-free survival (RFS) of all patients with ≥3 years of follow-up (n = 54) stratified by DDPR risk group. An estimate for relative risk of relapse was used to assign a risk group to each patient (pre-validated in the training cohort; predicted in the validation cohort; see Methods). P-values were calculated using the log-rank test. Log-rank tests for the training cohort alone: p = 5.6×10⁻⁶; validation cohort alone: p = 0.040. RFS estimates, standard error, number of patients at risk, and p-values for both groups at 5 and 7 years are shown on the right (5 years p = 1.02×10⁻³, 7 years p = 3.03×10⁻⁶). BCR-XL, B-cell receptor crosslink; TSLP, thymic stromal lymphopoietin; PVO4, pervanadate.

