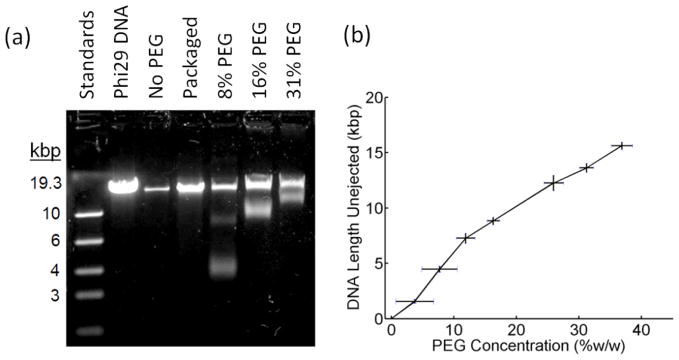
FIG. 2.
(a) Gel electrophoresis of DNA remaining unejected with varying PEG concentrations (%w/w). Also shown are DNA length standards, full length phi29 DNA, and packaged phi29 DNA extracted from capsids. (b) Length of unejected DNA vs. PEG concentration. Each measurement was repeated ≥3×. Error bars in the length measurements indicate standard deviation and errors in the PEG concentration were determined by weighing the PEG solutions.

