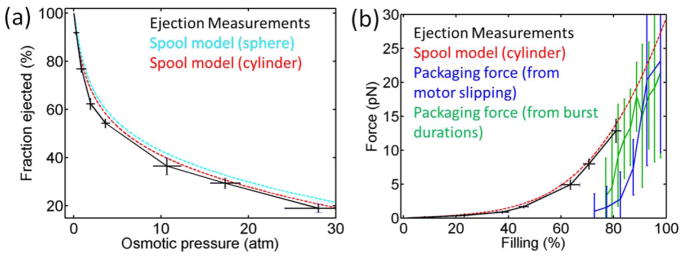
FIG. 3.
(a) Fraction of phi29 genome length ejected vs. applied osmotic pressure (black points). Error bars were determined as in Fig. 2. Shown for comparison are predictions of the inverse spool model assuming a cylindrical capsid (dashed red line) and spherical capsid (dashed cyan line), as described in the text. (b) Comparison of internal force vs. capsid filling (% of genome length packaged) inferred from the ejection measurements (black points), predicted by the spool model assuming a cylindrical capsid (dashed red line), inferred from motor slipping measurements during packaging [27] (blue points; error bars show standard error in the mean), and inferred from motor burst duration measurements [26] (green points).

