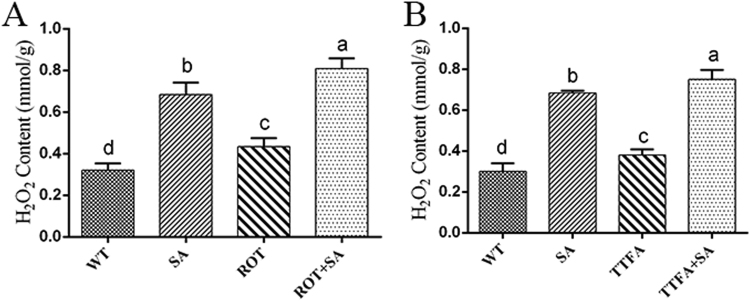
Fig. S2.
Effect of Rot and TTFA on the H2O2 content in G. lucidum under SA treatment. A. Amount of H2O2 in the WT strain after treatment with 5 μM Rot and 100 μM SA. B. H2O2 amount in WT cells after treatment with 10 μM TTFA and 100 μM SA. The values are the means ± SDs of three independent experiments, and different letters indicate significant differences between the lines (P < 0.05, according to Duncan's multiple range test).

