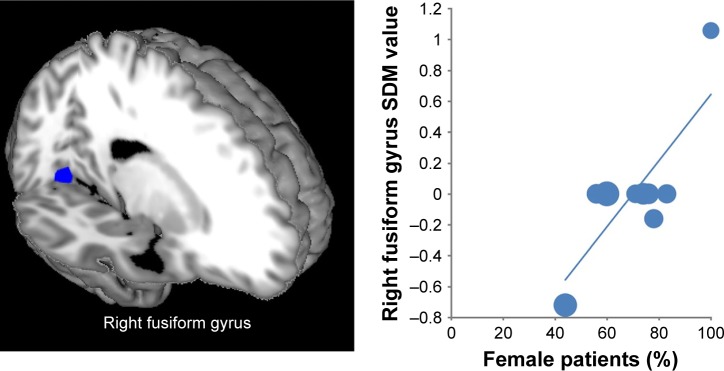
Figure 3.
Results of the meta-regression analysis showing the percentage of female patients with a positive relationship with activation in the right fusiform gyrus. In the graphs, AES-SDM values needed to create this plot were extracted from the peak of maximum slope significance, and each study is represented as a dot, whose size reflects sample size. The regression line (meta-regression signed differential mapping slope) is shown.
Abbreviations: AES, anisotropic effect-size; SDM, signed differential mapping.

