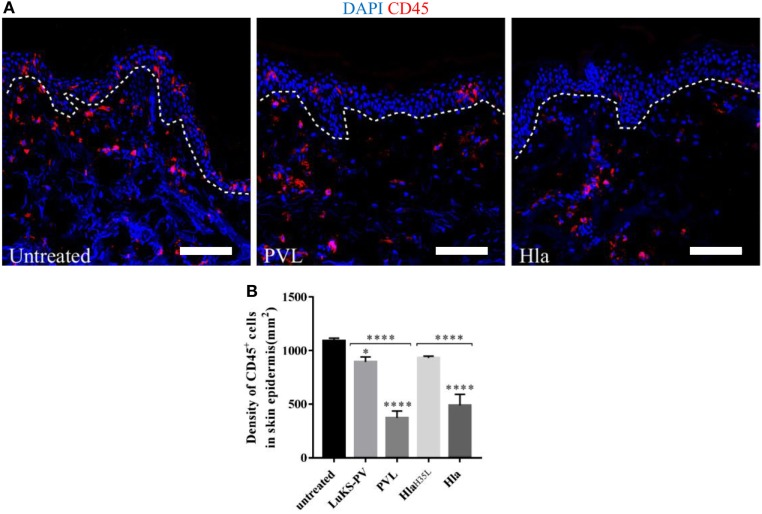
Figure 3.
(A) Cryosections of human skin explants showing the distribution of CD45-positive cells in the epidermis of human skin 24 h post-treatment with 5 µg Hla or Panton–Valentine leukocidin (PVL). Scale bar is 100 μm. The white dotted line represents the border between the epidermis and dermis. (B) The density of CD45 cells was calculated by counting CD45-positive cells in three to four random fields of skin sections. The density of cells measured as cell-density per square micrometers but expressed in cell-density per square millimeters. Statistically significant differences were determined by one-way ANOVA, with Tukey’s multiple comparison tests, *p < 0.05 and ****p ≤ 0.0001. Asterisks on bars are comparisons between untreated and treated groups while lines above bars are comparisons between the treated groups.

