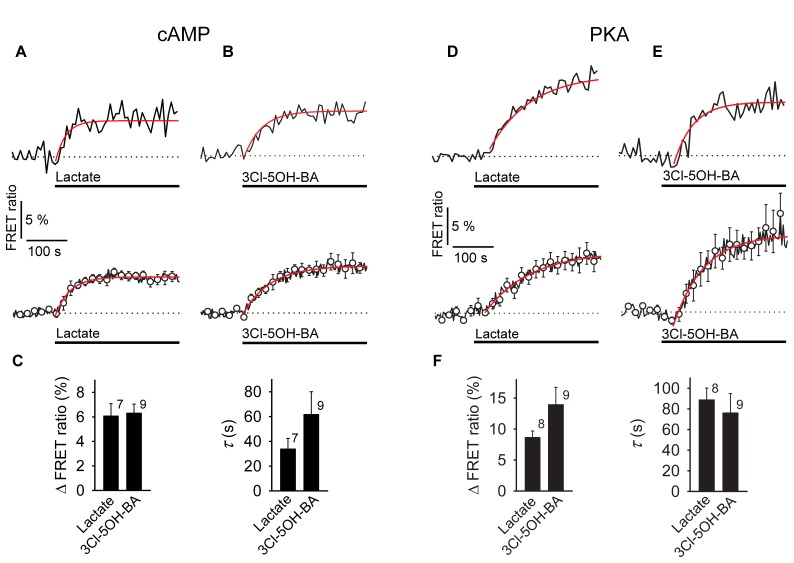
FIGURE 1.
Application of L-lactate and 3Cl-5OH-BA increases [cAMP]i and the intracellular PKA activity in rat astrocytes. (A,B) Representative (above) and mean time-course (below) of the Epac1-camps FRET ratio signal upon the addition of (A) L-lactate (20 mM) and (B) 3Cl-5OH-BA (0.5 mM), a selective agonist of the GPR81 receptor. Data are expressed as percentages of the inverse FRET ratio signal (CFP/YFP) relative to the baseline values. Single exponential rise functions were fitted to the curves: (A, above) FRET ratio = [0.98 ± 0.01] + [0.06 ± 0.01] × (1 – exp(–t/[25.00 ± 5.63 s])), (A, below) FRET ratio = [1.00 ± 0.00] + [0.05 ± 0.00] × (1 – exp(–t/[ 35.71 ± 2.55 s])), and (B, above) FRET ratio = [0.94 ± 0.00] + [0.06 ± 0.01] × (1 – exp(–t/[41.49 ± 5.85 s])), (B, below) FRET ratio = [1.00 ± 0.00] + [0.07 ± 0.00] × (1 – exp(t/[66.67 ± 4.42 s])). Note that the addition of L-lactate and 3Cl-5OH-BA increased the FRET ratios, indicating increases in [cAMP]i. Each data point represents the mean ± s.e.m. (C) Mean changes in the FRET ratio (ΔFRET ratio) and mean time-constants (τ) upon L-lactate and 3Cl-5OH-BA stimulation. Changes in FRET ratio are expressed as percentages relative to the initial values. The numbers by the bars depict the number of cells analyzed. Data are shown as the means ± s.e.m. (D,E) Representative (above) and mean time-course (below) of the AKAR2 FRET ratio signal upon addition of (D) L-lactate (20 mM) and (E) 3Cl-5OH-BA (0.5 mM). Data are expressed as percentages of the FRET ratio signals (YFP/CFP) relative to the baseline ratio values. Single exponential rise functions were fitted to the curves: (A, above) FRET ratio = [1.01 ± 0.00] + [0.10 ± 0.00] × (1 – exp(–t/[90.91 ± 8.26 s])), (A, below) FRET ratio = [1.00 ± 0.00] + [0.08 ± 0.00] × (1 – exp(–t/[111.11 ± 9.91 s])), and (B, above) FRET ratio = [0.97 ± 0.01] + [0.10 ± 0.01] × (1 – exp(–t/[47.62 ± 4.54 s])), (B, below) FRET ratio = [0.98 ± 0.00] + [0.12 ± 0.00] × (1 – exp(–t/[71.43 ± 5.10 s])). Note that the addition of L-lactate and 3Cl-5OH-BA increased the FRET ratios, indicating increased PKA activity. Each data point represents the mean ± s.e.m. (F) Mean changes in the FRET ratio (ΔFRET ratio) and mean time-constants (τ) upon L-lactate and 3Cl-5OH-BA stimulation. The numbers by the bars depict the number of cells analyzed. Data shown are in the format of the mean ± s.e.m. Data for every set of experiment was acquired from at least two different animals.

