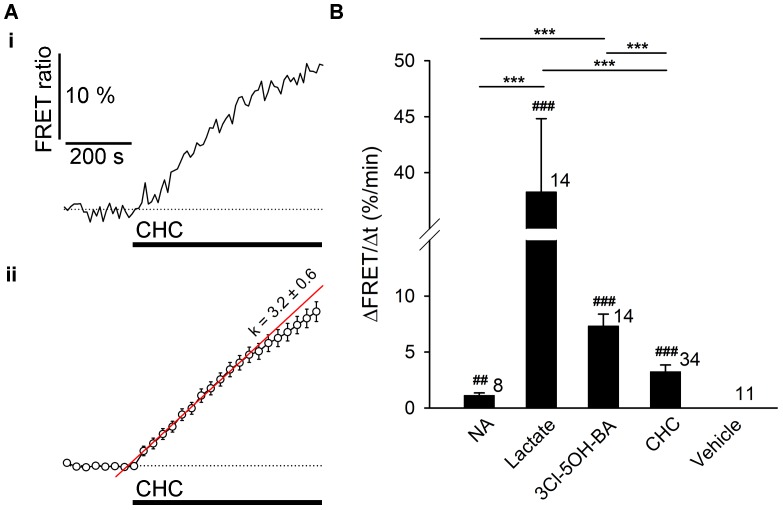
FIGURE 6.
The resting rate of glycolysis and lactate production is modulated by noradrenaline and 3Cl-5OH-BA in astrocytes. (A) Representative (i) and mean (ii) time-course of Laconic FRET ratio signal upon addition of 6 mM CHC. Data are expressed as the percentage of the FRET ratio signal (mTFP/Venus) relative to the baseline ratio values. Note that the increased FRET ratio indicates an increase in [lactate]i. Each data point in (ii) represents mean ± s.e.m. The initial rate of change in [lactate]i was determined by fitting the regression lines to the initial rise of the curves. The regression line in (ii) has the form of:ΔFRET (%) = k (%/min) × Δt (min) + ΔFRET0, where t is time, ΔFRET0 is ΔFRET at the time of stimulus, and the k-slope is the initial ΔFRET rise: k = 3.2 ± 0.6 %/min. (B) Comparison of mean maximal initial rates in FRET ratio changes (ΔFRET/Δt) upon the addition of NA (200 μM), L-lactate (20 mM), 3Cl-5OH-BA (0.5 mM), CHC (6 mM), and vehicle (control) in astrocytes. Maximal initial rates are expressed as percent change of FRET ratio per minute. Numbers by the error bars depict the number of cells analyzed. ∗∗∗P < 0.001 one-way ANOVA comparison between different types of stimuli; ##P < 0.01, ###P < 0.001 one-sample t-test. Data for every set of experiment was acquired from at least two different animals.

