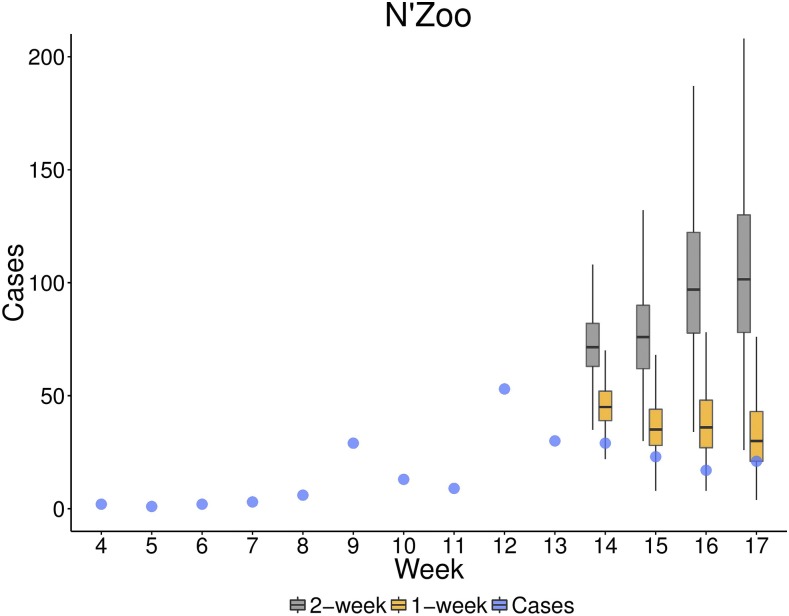
Figure 7.
Predicted cases in weeks 14–17 from fitting time-series susceptible-infected-recovered (TSIR) models for N’Zoo when R0 and a are allowed to vary using 1- and 2-week time steps to the Week 13 report. The reported cases in N’Zoo are given by blue dots. Box plots indicate the interquartile range of posterior estimates. Predictions when we use a 2-week time step in the TSIR model are plotted in gray and when using a 1-week time step in yellow. Boxes represent the interquartile range and whiskers represent the 95% credible interval of posterior estimates. This figure appears in color at www.ajtmh.org.

