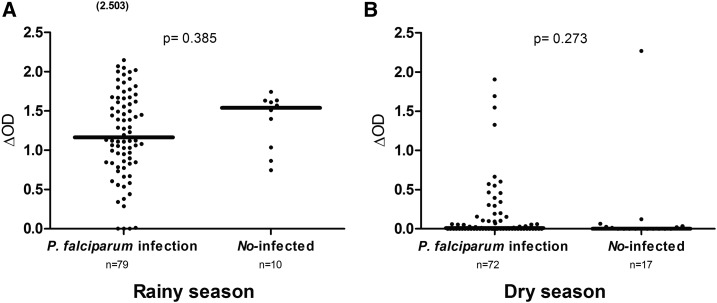
Figure 2.
Immunoglobulin G (IgG) response levels to gambiae Salivary Gland Protein-6 peptide 1 (gSG6-P1) peptide from uninfected and infected children. Dot plots indicate the individual IgG level (Δ optical density [OD] value) to the gSG6-P1 peptide from uninfected individuals and children with Plasmodium falciparum infection in the rainy season (A) and in the dry season (B). The P value was determined according to the Mann–Whitney U test. Number in parentheses in (B) above the dot plots indicates values greater than OD = 2.5.

