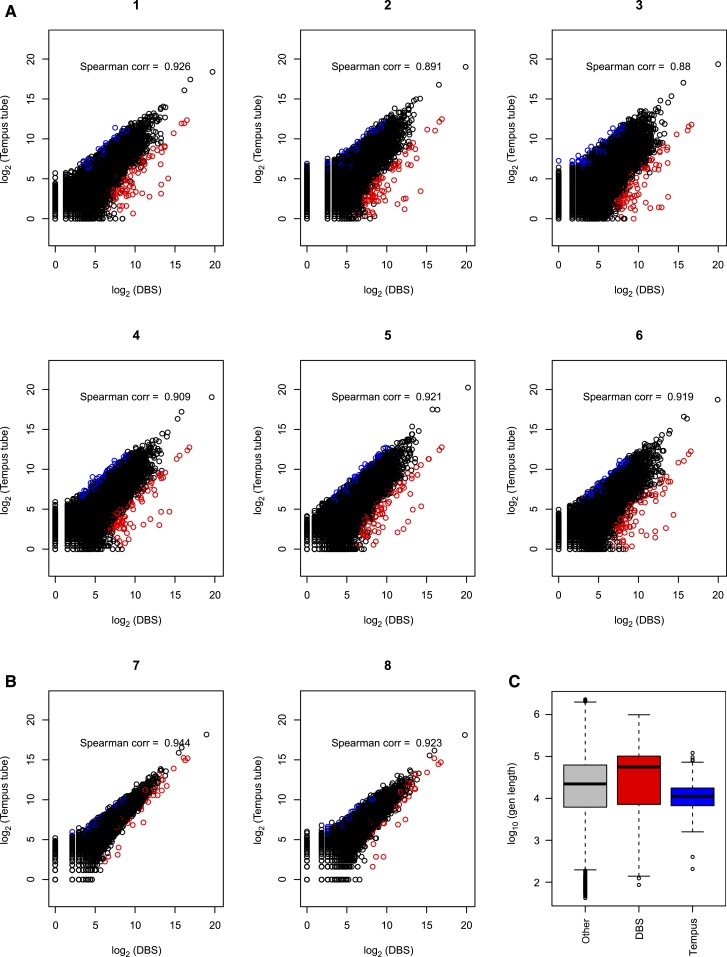
Figure 1.
Correlation of counts for gene expression data from dried blood spot (DBS) RNA and whole blood RNA. The gene counts were plotted and Spearman correlation calculated for six subjects who had polyA selection of non-ribosomal RNA from whole blood (A) and two subjects who had rRNA depletion from whole blood (B). All DBS-derived RNA had rRNA depletion before RNA-seq. Points in red on the graphs are those genes that have average fold changes (fold change in each subject is defined as counts from DBS over whole blood) in the top 1% and average normalized log2 counts greater than five. Points in blue are those genes whose average fold changes fall in the bottom 1% (genes with increased expression in whole blood compared with DBS) and average normalized log2 counts greater than five. Lengths of genes in the top and bottom 1% fold-change groups are compared with the length of remaining 98% genes (taking this as the reference gene set). (C) Genes with increased counts in DBS are longer than other genes by rank sum test (P = 0.003). Genes with increased counts in whole blood are shorter than other genes by rank sum test (P value < 0.001).

